| Verifications of the Battery Adaptation in the Market and Estimation of Battery Life for EV, HEV (1) |
|
Abstract
As part of our comprehensive efforts at Nissan to meet zero-emission vehicle (ZEV) standards and promote conservation of energy resources, we put the Prairie EV on the market in 1997, the Altra EV in 1998, the Hypermini in 1999 and the Tino HEV (Hybrid Electric Vehicle) in 2000. These vehicles have been the first in the world to be fitted with advanced lithium-ion batteries.
In putting these lithium-ion batteries on the market, it was necessary to make sure that they were actually suitable to real-world use. It was confirmed that the lithium-ion batteries possess outstanding energy density, power density and charging/discharging efficiency, compared with other types of batteries, thereby verifying their suitability for EV and HEV application. Another important factor in evaluating suitability for real-world use is service life. As part of the work done to confirm that the service life of the lithium-ion batteries would meet market requirements, a method was developed for estimating battery deterioration based on battery load conditions and the results of cell durability tests.
This paper describes the method for estimating the rate of deterioration shown by lithium-ion batteries under real-world conditions and presents validity of this method.
Keywords: EV, HEV, market, calculation, cycle life
1 Introduction
The major vehicle models fitted with lithium-ion batteries that we have put on the market these last few years are listed in Table 1. The following discussion concerns the Altra EV and the Tino HEV.
Approximately three years have now passed since the Altra EV was put on the market and about two years have passed since the Tino HEV was released. During this interval, we obtained and analyzed vehicle operating data (distances driven, battery temperature, etc.) for Altra EVs with combined cumulative mileage of 460,000 miles and Tino HEVs with combined cumulative mileage of 600,000 miles as well as data on their actual battery deterioration. Those data were used in validating the method of estimating battery deterioration.
Figures from No.1 to No.4 show the photos of EV (Prairie EV, Altra EV, and Hypermini respectively) and Tino HEV. Figures from No.5 to No.6 show the photos of the batteries for EVs and HEV respectively.
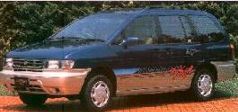
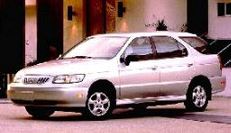
Fig.1:Photo of Prairie EV Fig.2:Photo of Altra EV
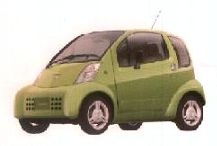
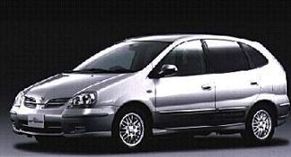
Fig.3:Photo of Hypermini Fig.4:Photo of Tino HEV
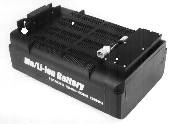
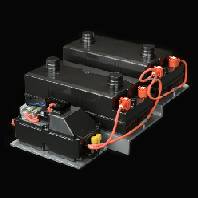
Fig.5:Photo of a battery module for EV Fig.6:Photo of a battery pack for Tino HEV
2 Method of Estimating Battery Deterioration
2.1 Features of battery deterioration
Lithium-ion batteries experience two types deterioration, cycling deterioration that develops as a result of repeated charging and discharging and storage deterioration that proceeds under a no-load condition. Both cycling deterioration and storage deterioration are greatly dependent on depth of discharge (DOD) and battery temperature.
An example of battery deterioration as a function of DOD is shown in Fig.7, which illustrates a typical pattern of battery capacity deterioration in the case of an EV battery. The horizontal axis indicates DOD, and the vertical axis shows the relative deterioration rate, when the capacity deterioration rate at 0% DOD equals one. It is clear that the relative deterioration rate changes depending on DOD. An example of battery deterioration as a function of battery temperature is given in Fig.8, which shows a typical pattern of capacity deterioration of an EV battery during storage. The horizontal axis indicates the battery temperature and the vertical axis shows the relative deterioration rate when the capacity deterioration rate at 25°C equals one. It is seen that the relative deterioration rate changes depending on the battery temperature.
Fig.7:Correlation between DOD and relative battery deterioration rate
Fig.8:Correlation between battery temperature and relative battery deterioration rate
2.1.2 Capacity and power deterioration
As battery deterioration progresses, battery capacity and power decline. Figure 9 illustrates the deterioration characteristics of a battery. Line A in the figure shows the quantity of energy discharged and battery power when a new battery is discharged. As discharging continues, the power decreases. As the amount of energy discharged declines as indicated by (1). In addition, as power deterioration proceeds, battery output drops as indicated by (2). Deterioration of EV batteries was defined in this study as the rate of change in (1) that indicates capacity deterioration because the driving range on a single charge is a critical factor. Deterioration of HEV batteries was defined as the rate of change in (2) that indicates power deterioration because it must be capable of discharging and accepting energy instantaneously.
Fig.9:Battery deterioration characteristics
Reference
Fumihiko Saito, Norihiko Hirata, Shinya Ogata, Kenichi Sakai and Takeshi Miyamoto
Verifications of the Battery Adaptation in the Market and Estimation of Battery Life for EV, HEV
The 18th International Electric, Fuel cell and Hybrid vehicle Symposium October 20-24, 2001 Berlin, Germany
|
|